
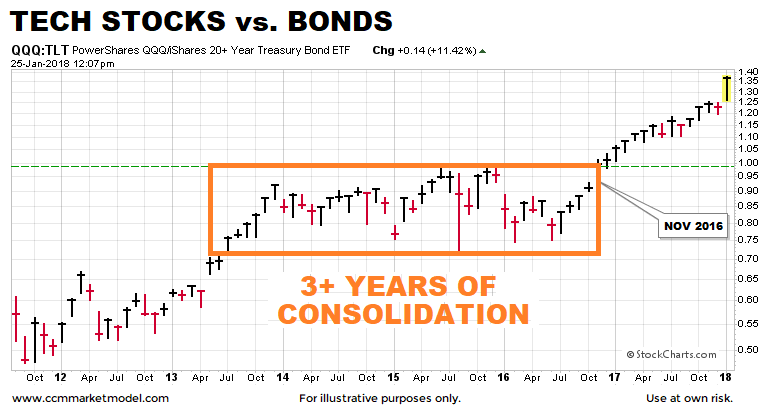
QQQ vs. TLT Monthly
Clients and regular viewers of CCM's weekly videos are familiar with the expression:
Harder markets are followed by easier markets.
The monthly chart below shows the performance of the NASDAQ 100 ETF (QQQ) relative to long-term Treasuries (TLT). The orange box highlights a long-term period of indecisiveness; a period that ended with the bullish breakout in November 2016.
The Net-Aggregate Opinion
The ratio above reflects a significant shift in favor of growth-oriented assets relative to defensive-oriented assets. We are seeing a similar, but much longer-term breakout in the SPY:TLT ratio (S&P 500 vs. Bonds). Notice how the ratio below peaked in May 2007, or four months before the S&P 500 peaked. As of this writing, there are no similar yellow flags waving. We will continue to take it day by day.
