Testing A Recent Market Hypothesis

An April 5 video covered a rare momentum shift in the S&P 500 that went into the history books on March 29 (see point A below). The study was updated in this week’s video, which can be found below in this post. The second leg of the study was conducted after the 12th consecutive weekly close above the S&P 500’s weekly MACD centerline (see point B below).

short-takes-ciovacco-mac-dw.png

Given the market has pulled back since April 5, does the magnitude of the pullback between point A and point B raise concerns relative to market pullbacks that took place over a similar seven-week period in the sixteen historical cases? The answer is no. The table below shows the median drawdown that took place between similar points in the historical cases was 3.35%; the maximum drawdown was 7.06%, with 81% of the sixteen cases seeing a drawdown of less than 5%. The S&P 500’s 2019 drawdown comes in at a similar level of 4.55%.

short-takes-ciovacco-max-draw-macd-1.png

Thus, to date, the market has not done anything to seriously jeopardize the original finding of keeping an open mind about better than expected outcomes in the stock market over the next 2-3 years. More details about the studies and the market’s subsequent historical performance can be found in the video below. Our schedule required this week's video to be recorded offsite.... if audio seems a bit off, should be back to normal next week.

SPEAKS TO ODDS

Each year is unique and 2019 will follow its own path. The 2019 setup and the market’s performance in the sixteen historical cases help us assess the probability of good things happening over the next few years relative to the probability of bad things happening. The U.S./China trade situation remains fluid, reminding us to maintain a flexible, unbiased, and open mind about shifts in the headlines and data.

Trade War: Escalation Phase

The dramatic turn in the trade negotiations that has taken place since the stock market closed on Friday, May 3 is captured in the segment below from The Wall Street Journal:

“The U.S. and Chinese governments both sent signals ahead of their trade talks in Washington last week that a pact was so near they would discuss the logistics of a signing ceremony. In a matter of days, the dynamic shifted so markedly that the Chinese deliberated whether to even show up after President Trump ordered a last-minute increase in tariffs on Chinese imports because the U.S. viewed China as reneging on previous commitments.”

The markets are adjusting to the shift from a cooperative phase in the trade war to an escalation phase. The drop in the U.S. stock market futures on the morning of May 13 after China announced another set of tariffs on U.S. goods sends a clear message the financial markets are concerned about the economic damage that could come from an ongoing and combative trade war. The million-dollar question is how long will the current escalation phase last? Markets will have higher odds of stabilizing if the U.S. and China can show some signs of possibly making their way back to the negotiation table.

BIGGER PICTURE

There has been a slight shift in the data associated with the market’s long-term trend, but nothing earth-shattering at this point. Today’s relatively small adjustment to our asset mix got us back in line with the data and respects the uncertainty related to the duration of the current decline.

short-takes-may-12-2019-a.png

The market’s waning momentum in recent weeks told us to be open to a normal 4-10% pullback in the S&P 500. As of Monday’s close, the S&P 500 has experienced a drawdown of 4.55% based on closing prices and 5.17% using the recent intraday high and intraday low.

FIRST 90% DOWN DAY

Monday brought the first day in 2019 that featured extremely lopsided volume figures. Over 90% of NYSE volume was associated with declining issues.

short-takes-spx-may-13-2-C.png

We know a 5% correction falls into the normal and to be expected category. How concerning is a 90% down day? As shown in the table below from Pension Partners, forward returns and percent positive figures for the S&P 500 are slightly better following a 90% down day relative to an average day.

short-takes-90-down-days.png

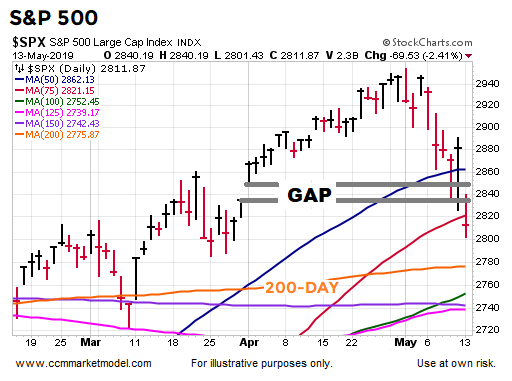
The chart below provides a good visual proxy for the, thus far, relatively small shift in the data related to the market’s longer-term trend. The S&P 500 closed below the 50-day and below the gap. Price still remains above a still upward-sloping 200-day.

short-takes-spx-may-13-2.png

The VIX was a mixed bag during Monday’s session. It printed a daily closing high above last week’s high, but the intraday spike was lower than last week’s spike. Since closing prices tend to be more relevant, it is probably fair to say the VIX closed Monday in “still concerned” mode.

short-takes-may-12-2019-b.png

As noted in this video clip, even under a favorable longer-term outcome scenario, the market may continue to be volatile over the next 90 days. It is possible we will sit tight for the remainder of the week; it is possible the data will call for additional incremental steps to reduce exposure to risk assets. We will continue to take it day by day with an open mind about all outcomes.

This post is written for clients of Ciovacco Capital Management and describes our approach in generic terms. It is provided to assist clients with basic concepts, rather than specific strategies or levels. The same terms of use disclaimers used in our weekly videos apply to all Short Takes posts and tweets on the CCM Twitter Feed, including the text and images above.