NEW DEVELOPMENT IN TUESDAY’S SESSION
A November 14 Short Takes post compared the present day S&P 500 to the major low in February 2016. If you reviewed those charts in detail, you may have thought the 2018 market seems to be a few days behind the look of the 2016 chart (we thought that). Below are the same charts updated as of the close on Tuesday, November 20, 2018 (right side). You may recall our original comments about the charts:
“If we compare the strength of the move off the first low (compare A to B), you can make a case that numerous indicators looked stronger at point B then they did at point A. For example, in 2016 CCI never approached 100; in 2018 CCI recently cleared 100.”
ANOTHER INTERESTING SIMILARITY
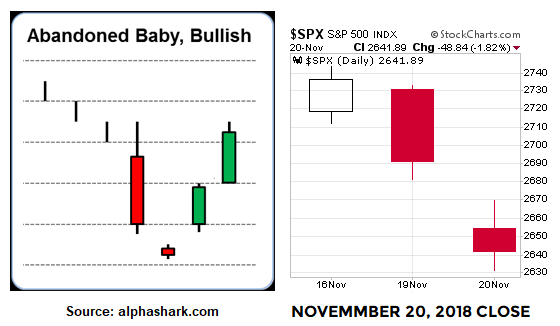
Tuesday’s session in the S&P 500 featured a gap down. The lowest low in 2016 also featured a gap down.
ABANDONED BABY SETUP
The image/text below comes from Investopedia.
The first and incredibly important part of the definition above is the potentially bullish abandoned baby is a THREE candlestick pattern. In 2018, we have 2 of the 3 candles, which leaves this firmly in the TBD category. The image below provides another example of the setup relative to the S&P 500’s close on Tuesday.
What does price action from Tuesday, November 20, 2018 tell us? The market gapped down due to high conviction to get out near the open. The doji-like candle on the daily chart (above right) tells us after the market opened, the battle between bullish conviction and bearish conviction was fairly balanced (unlike the open). The S&P 500 gapped down at the open and traded at 2462 in the first 25 minutes; it closed at the same level at 4:00 pm ET (orange horizontal line below).
HOW MUCH STOCK DO YOU PUT IN THE SETUPS ABOVE?
The simple answer is “not much at all until the market shows us something in 2018”. However, the information does provide “try to be patient” hard data relative to the possibility of a reversal in stocks. As noted numerous times, setups are useless without market confirmation. In 2018, confirmation means some hard data showing an increase in the conviction of buyers relative to the conviction of sellers (some good-looking green candlesticks). As of this writing, we do not have it; still have Wednesday and Friday to go this week.
OTHER TAKEAWAYS FROM 2016 LOW
We cannot think about binary and clean outcomes; markets are much messier in the real world. For example in 2016, if we thought (a) a lower low means a retest fails or (b) several lower closes below the prior closing low means a retest attempt is dead in the water, we would have missed the move that followed.
Those who remained flexible and kept an open mind in 2016 had much better odds of participating in the big gain that followed the retest of the low.
The chart above reminds us how profitable it can be to be patient during periods of high volatility and stress.
IF THE SETUPS FAIL?
The market has proven very little over the past few sessions. Thus, it is prudent to maintain a skeptical bias until we see something above and beyond a setup. Even if these setups fail, we still learn something and it will add to the weight of the evidence on the bearish side of the ledger. A post from earlier today provides some additional comments about what we will be looking for in the days ahead.


