Learning From 1995-2000
As we have noted on numerous occasions over the past year, market setups in the 1994-1995 period are similar to the 2016-2017 period. The strong trends that were present in 2017 are similar to the low-volatility year 1995. Therefore, it may be helpful to examine volatility in the entire 1995-2000 period to help form more realistic expectations about volatility going forward.
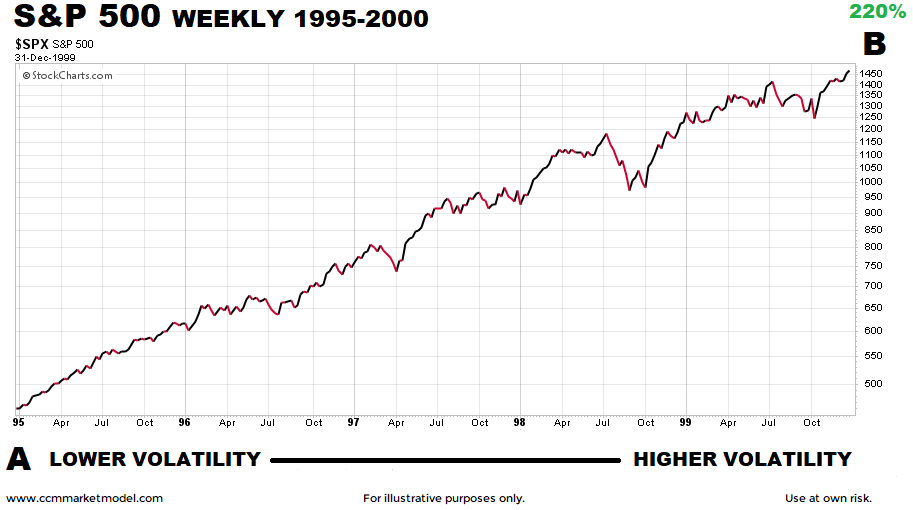
- The early stages of a new secular trend can be marked by low volatility and very consistent price action (see left side of chart above).
- As the trend matures, volatility increases, telling us to mentally prepare for an increase in the red day/green day ratio over the next 12 to 24 months.
- Even in periods that feature strong bullish trends, red days, red weeks, and red months are common. Thus, if bullish trends continue over the next few years, none of us should be surprised when the normal and to be expected givebacks occur.
- Higher volatility is a characteristic of late stage rallies; lower volatility is a characteristic of early-stage and more sustainable trends. Numerous historical cases illustrate the point in a separate post.
- To capture a significant portion of the 220% gain between point A and point B above, an investor had to endure a significant amount of volatility along the way. Volatility is not the enemy. Our goal is not to avoid volatility, but rather to prudently discern between volatility to ignore and volatility to respect.
But, 1994-1995 Was Different
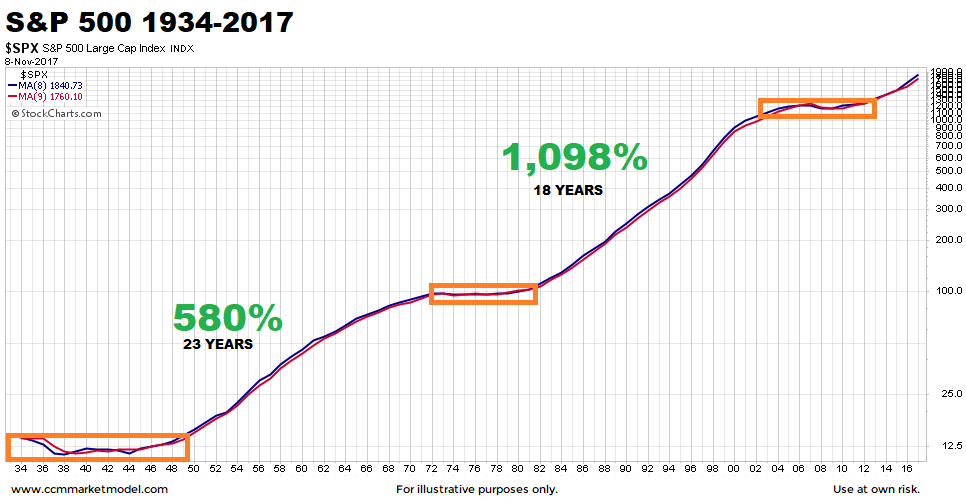
All periods in market history are unique. No two periods have the same combination of earnings, valuations, interest rates, inflation, geopolitics, etc. In the chart below, was 1950 significantly different from 1982? Of course, but the combination of factors in both periods produced extremely satisfying long-term returns for investors with a good understanding of normal market volatility.
SIGNAL: TWO TIMES LAST 63 YEARS
Two hundred sixty-six calendar days ago, the charts told us to be open to "a life-changing rally in stocks". Given the market has risen significantly since then, it is prudent to review the charts to examine a logical question: