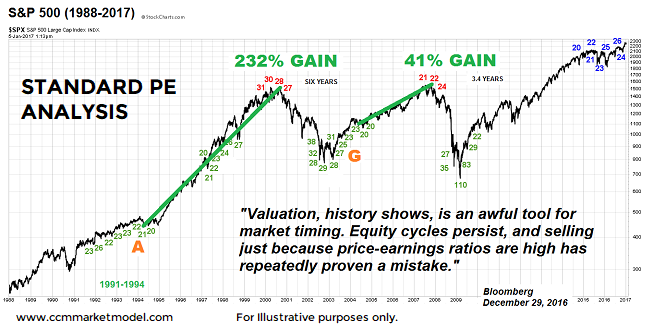
Shiller's PE is a Different Animal
When a similar question was asked about standard price-earnings ratios in 2017, based on the chart below, it was relatively easy to determine their utility from a market-timing perspective. In this analysis, we examine the Shiller PE or the Cyclically Adjusted Price Earnings Ratio (CAPE).
ADDING THE CAPE RATIO TO STOCK CHARTS
Given the level of detail required to perform an analysis of the Shiller PE, it is best accomplished in video form. Like the standard PE graph above, the video below covers numerous examples of stock market set-ups in the context of the CAPE ratio. Specifically, the video addresses the following questions:
- What type of environment are we facing in January 2018?
- If we study similar historical environments, was the Shiller PE helpful?
- Does the Shiller PE negate the recent long-term bullish breakouts in stocks?
- Is stock market upside limited by Shiller readings?


