Bulls Trying To Make A Stand

DOOR TO A BULLISH BOTTOMING PROCESS REMAINS OPEN

During the trading session on Monday, August 19, the “bottoming process” case for the stock market remained intact. The NYSE Common Stock A-D Line held the line last week at a logical level associated with the S&P 500 reversals in March and June (chart below).

short-takes-spx33ax2.png

A similar, thus-far-holding-the-line argument can be made using the weekly NASDAQ A-D Volume Ratio. Nothing says breadth will continue to hold these levels, but so far they tell us remain open to stocks trying to push higher in the coming days/weeks.

short-takes-spx33axB.png

THE WEIGHT OF THE EVIDENCE

This week’s stock market video takes a weight-of-the-evidence approach by reviewing both fundamental and technical data, allowing you to draw you own conclusions.

MORE DOWNSIDE WOULD NOT BE SHOCKING

For our approach and our timeframe, the important thing is not what the market does in the next two or three sessions, but rather how things play out over the next two to three years. Thus far, the S&P 500 has made stands near the area of possible support shown after the ugly session that took place on Monday, August 5. An updated version of the chart is shown below.

short-takes-spx33ax2Bv.png

As noted on numerous occasions over the past two weeks, we have to tactically and mentally account for the possibility of more downside even if good things eventually happen in the coming weeks and months. We have kept some powder dry in the event the market decides to move back toward the 2760-ish to 2790-ish range. The S&P 500 was trading at 2925 during the session on Monday, August 19.

short-takes-spx33ax2BvM.png

THE BULLS STILL HAVE TO PROVE IT

Bullish setups have been forming since Monday, August 5. Setups can be followed by positive follow-through or failure. Given concerns about global economic weakness, rare behavior in the bond market, and a speech from a Fed Chairman that has been known to spook markets via off the cuff remarks, it is extremely important that we remain open to all outcomes, from wildly bullish to wildly bearish. We will continue to take it day by day.

This post is written for clients of Ciovacco Capital Management and describes our approach in generic terms. It is provided to assist clients with basic concepts, rather than specific strategies or levels. The same terms of use disclaimers used in our weekly videos apply to all Short Takes posts and tweets on the CCM Twitter Feed, including the text and images above.

Are National Financial Conditions Saying The Stock Market Is In Big Trouble?

The Chicago Fed National Financial Conditions Index allows us to better understand the present day in the context of economic and stock market history. According to the Chicago Fed, the National Financial Conditions Index provides:

“A comprehensive weekly update on U.S. financial conditions in money markets, debt and equity markets and the traditional and shadow banking systems. Positive values of the NFCI indicate financial conditions that are tighter than average, while negative values indicate financial conditions that are looser than average.”

Since the yield curve is derived from yields on U.S. government bonds that are backed by the full faith and credit of the U.S. government, the yield curve tells us very little about the market’s perception of default probabilities and counterparty risk. When the National Financial Conditions Index rises, it is indicative of decreasing trust and tighter financial conditions. When the National Financial Conditions Index is falling or at low levels, it is indicative of higher trust within the financial system and more favorable access to capital. Therefore, we can learn something about August 2019 by comparing current financial conditions to financial conditions before large drops in the S&P 500 Index.

HISTORICAL CASES

In October 1973, before the S&P 500 dropped 44%, the National Financial Conditions Index had a reading of 2.13, which aligns with much tighter than average financial conditions and lower levels of confidence and trust.

nfci1973.png

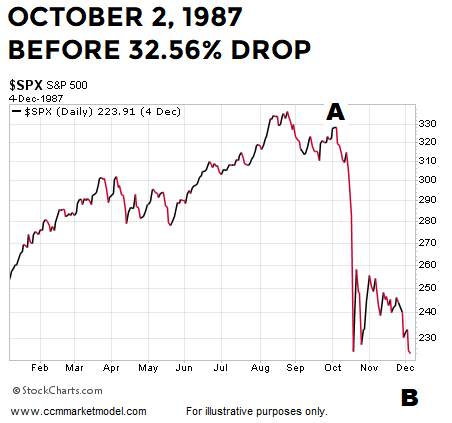
In October 1987, before the S&P 500 dropped 33%, the National Financial Conditions Index had a reading of 0.02.

nfci1987.png

In July 1990, before the S&P 500 dropped 20%, the National Financial Conditions Index had a reading of -0.20.

nfci1990.png

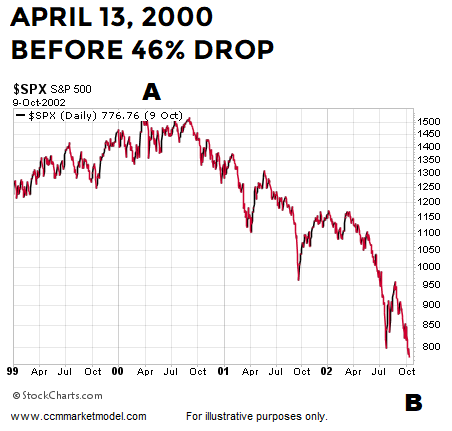
In April 2000, before the S&P 500 dropped 46%, the National Financial Conditions Index had a reading of -0.18.

nfci2000.png

In December 2007, before the S&P 500 dropped 54%, the National Financial Conditions Index had a reading of 0.32, which aligns with tighter than average financial conditions and lower levels of confidence and trust.

nfci2007.png

In July 2011, before the S&P 500 dropped 19%, the National Financial Conditions Index had a reading of -0.25%.

nfci2011.png

HOW DO FINANCIAL CONDITIONS COMPARE IN 2019?

Remember, according to the Chicago Fed, “negative values indicate financial conditions that are looser than average.” Therefore, the lower the reading the better. The last reading of the National Financial Conditions Index was posted on August 2 and came in at -0.85, which is the most favorable reading relative to the cases above by a wide margin. In fact, the August 2, 2019 reading is one of the most favorable readings seen in the last decade and looks much better than the last elevated period in 2011.

short-takes-national-financial-conditions-index-a.png

If we go back to 1990, the graph below shows current financial conditions are much more favorable than they were near recessionary periods in 1990-91, 2000, and 2007-09 (shaded areas). Concerns in the present day would increase if the National Financial Conditions Index started to spike higher, as it did in July 2007.

national-financial-conditions-index-today.png

YIELD CURVE AND BIGGER PICTURE

The 10-2 yield curve is moving closer to inversion, which means market participants believe the Fed is on the verge of what could be multiple rate cuts in the coming months. Since the yield curve has been covered by the media for over two years, it is possible 10-2 yield curve inversion could trigger some heavy selling, especially in the short run. If credit spreads begin to widen in a material manner and the National Financial Conditions Index begins to rise closer to the -0.10 to 0.30 range (last 2019 reading was -0.85), stock market concerns would increase. Given present day financial conditions remain constructive relative to history and given the material covered in this week’s stock market video, it is prudent to remain open to all outcomes.

BULL/BEAR GUIDEPOSTS

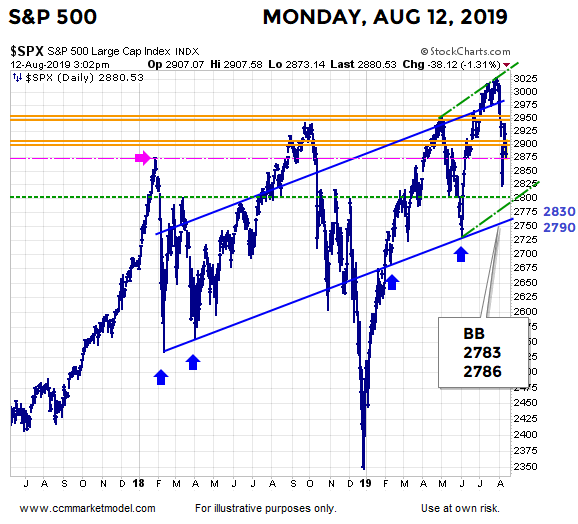
As noted last week, it would not be surprising to see the S&P 500 revisit the 2790 to 2830 area. At the end of last week, some notable Bollinger Band levels sat at 2783 and 2786. On Monday afternoon August 12, the S&P 500 was trading above all these levels at 2880. From a probability perspective, we will learn something either way (market holds, market drops below and holds below these levels).

ccm-market-model-ciovacco-spx-aug-12-2019.png