Market Hovering Near Important Guideposts

2008 CASE

As shown in the 2008 case below, it is not uncommon for markets to come back and test the 200-day moving average during a bear market.

st200708i.png

HEALTHY MARKETS

Healthy and sustainable long-term trends tend to feature a high percentage of trading days that close above the 200-day (example below). Thus, the longer a market can stay above the 200-day in the early stages of a rally attempt, the higher the odds we are dealing with a new trend rather than a countertrend move that will be followed by lower lows.

st2019cvb.png

2019 CASE

The S&P 500 dropped 19% between the September high and the December low. Monday’s session was the S&P 500’s ninth consecutive close above the 200-day moving average.

st2019cv.png

SIMILAR CASES

Dating back to 1950, if we look for S&P 500 cases that featured a 15-30% drop, followed by a push back above the 200-day, how did the market perform after closing above the 200-day for nine consecutive sessions? The answer is, from a longer-term historical perspective, quite well.

ST200Y.png

POSSIBLE PLUNGE RESISTANCE

In 2019, the S&P 500 has rallied back to an area that may offer some resistance. The S&P 500 closed at 2,813.89 on November 7, 2018. Monday’s intraday high was 2,813.49. There is nothing magical about 2,813; just as there is nothing magical about the 200-day moving average. They are simply reference points. On the way down, price moved above and below the 200-day, but had trouble holding above 2,813, which means this area may be relevant on the way back up.

st1958M2.png

A DIFFERENT PERSPECTIVE

This week’s stock market video highlights a rare dual setup involving Bollinger Bands and market breadth.

MEASURED APPROACH

There are numerous reasons to be optimistic about stocks. Over the past few weeks, we have seen noticeable improvement in the hard data tracked by the market model, including higher trend strength (TS) scores. However, the data, scores, and possible overhead resistance continue to align with a prudent and measured approach; something that is reflected in our portfolio mix. The longer the S&P 500 can hold above the 200-day, the more relevant it becomes. A sustained break above the S&P 500’s November 7, 2018 close (2,813.89) would also eliminate some short-term concerns.

This Never Happened In The 1974, 2001, and 2008 Bear Markets

JANUARY CLOSE PROVIDES INSIGHT

The chart below shows the S&P 500 closed above the monthly Bollinger Band centerline (a.k.a. center band) on January 31, 2019. The January print occurred after the S&P 500 closed below the centerline in December, but above the lower Bollinger Band.

BB 2019.png

1973-74 BEAR MARKET

As shown in the 1973-74 version of the same chart, notice how the S&P 500 was unable to recapture and close above the Bollinger Band centerline during the entire bear market. Unlike the 2019 case (thus far), the S&P 500 closed below the lower Bollinger Band in November 1973.

short-takes-ciovacco-bb6.png

DOT-COM BEAR MARKET

The same can be said for the 2000-02 bear market; the S&P 500 never closed back above the Bollinger Band centerline after closing below it in Q4 2000. As shown below, really bad things happened after Q4 2000. Unlike the 2019 case, the S&P 500 closed below the lower Bollinger Band in February 2001.

BB 2000.png

FINANCIAL CRISIS BEAR MARKET

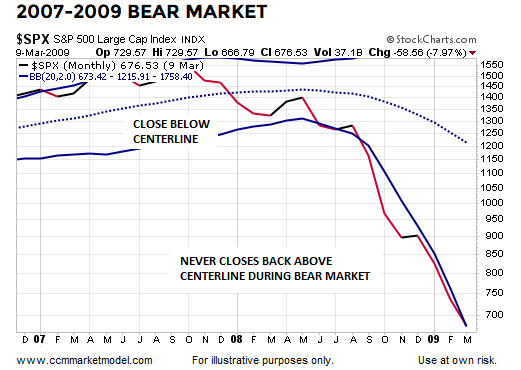
After stocks peaked in October 2007, the S&P 500 closed below the monthly Bollinger Band centerline in January 2008 and never closed back above it during the painful bear market. Unlike the 2019 case, the S&P 500 closed below the lower Bollinger Band in June 2008.

BB 2007.png

2019 LOOK IS RARE

It is relatively rare for the S&P 500 to move from above the monthly Bollinger Band centerline, close below the centerline while remaining above the lower Bollinger Band, and subsequently print a monthly close back above the centerline, which is what just happened in 2018-2019.

Dating back to 1950, there were thirteen similar looks that appeared on the S&P 500’s monthly chart. As shown in the table below, the bias for stocks over the next two years was favorable.

short-takes-bollingerbands-mm-b.png

CASES WITH BREADTH THRUSTS

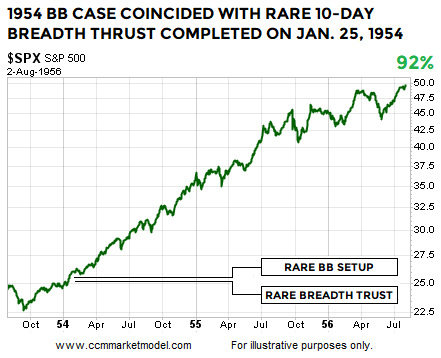
The monthly Bollinger Band setup described above is rare. It is interesting to note that two of the Bollinger band cases, 1954 and 1991, basically coincided with an extremely rare 10-day breadth thrust that was covered on January 21, 2019. Therefore, we have three cases that feature both the Bollinger Band setup and rare breadth thrust: 1954, 1991, and 2019.

The look of the monthly chart on the last trading day of January 1954 is similar to the rare look found at the end of January 2019.

short-takes-bb-1991-2B.png

The ten-day breadth thrust was completed on January 25, 1954, four trading days before the monthly Bollinger Band setup went into the books. Similar to 2019, price was near a flat-to-downish orange 200-day moving average.

short-takes-bb-1954-B2.png

The 1954 case that featured both setups was followed by very satisfying gains in the S&P 500 Index.

short-takes-ciovacco-capital-spx-1991-btC.png

1991 DUAL SETUP CASE

The look of the monthly chart on the last trading day of January 1991 is similar to the rare look found at the end of January 2019.

short-takes-bb-1991-2.png

The ten-day breadth thrust was completed on February 4, 1991, or two trading days after the monthly Bollinger Band setup went into the books. Similar to 2019, price was near a flat-to-downish orange 200-day moving average.

short-takes-bb-1991-B2.png

The 1991 case that featured both setups was followed by very satisfying gains in the S&P 500 Index.

short-takes-ciovacco-capital-spx-1991-btB.png

DIGGING DEEPER

This week’s stock market video covers numerous historical cases that provide additional insight into the 2019 bull/bear debate.

2015: WEAKER TRENDS ARE MORE PRONE TO FAILURE

The 2015 Bollinger Band case reminds us a significant giveback remains a possibility in 2019. The 2015 monthly BB setup was unable to hold above the centerline and turned out to be a head fake.

short-takes-bb-2015-A.png

Two other reminders come from the 2015 case:

Markets with still-vulnerable trend profiles are more prone to reversals, givebacks, and setup failures.

Closing above the orange 200-day moving average is far from an “all clear” signal in the stock market. In 2015, the S&P 500 closed above the 200-day for eight trading sessions, before falling 13.30%.

SPXCCV67B.png

MORAL OF THE STORY

Having something concrete and measurable that differentiates 2018-2019 from three of the greatest percentage-decline bear markets in history (73-74, 00-02, 07-09) speaks favorably to bull/bear probabilities in February 2019.

However, the 1957 and 2015 cases remind us head fakes and lower lows are still in the realm of possibility. In those periods, the stay above the monthly Bollinger Band centerline was short lived, meaning intermediate-term concerns would increase in 2019 if the S&P 500 prints a monthly close back below the Bollinger Band centerline, which currently sits at 2685.