Important Reminders

PRUDENT vs. PANIC

As noted on December 5, Tuesday’s big drop increases the odds of the S&P 500 taking another significant leg down. Thus, we have to be open to the possibility in the coming days and weeks that all four 2018 lows shown in this post will be violated. Notice the previous sentences contain the terms odds and possibility.

As covered in detail on November 23, from an ugly chart pattern, including one with price below a downward-sloping 200-day moving average and numerous high-selling pressure red sessions, really ugly things can happen and surprisingly favorable things can happen if the newscycle flips the script on something that is bothering the market.

Ugly Historical Charts Video.png

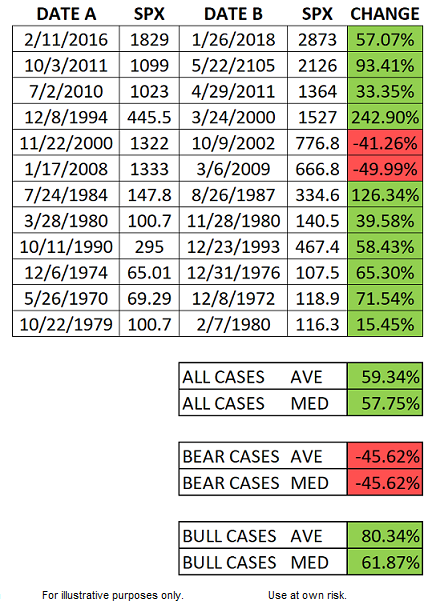
The November 23 video covered 13 cases, 12 historical and 2018. To help us keep an open mind and remain tactically and psychologically prepared for ALL outcomes, it is helpful to revisit the summary “what happened next” table regarding the 12 ugly historical setups.

Ugly Chart Patterns Summary Table b.png

As history clearly demonstrates, our plan must be able to handle a wide range of outcomes from seeing the S&P 500 drop an additional 40% to 50% to seeing something flip in the newscycle which could trigger a rally leading to gains between 60% and 80%. In all the historical cases above, it felt terrible and there appeared to be little hope of a rally, and yet, in 10 of the 12 cases something improved in the newscycle and the market’s technicals improved quickly. We saw an example of the newscycle flip recently when the Fed chairman made some favorable comments and stocks rallied sharply.

A HIGH DEGREE OF CONFIDENCE

Basic logic tells us if the S&P 500 is going to drop an additional 40% to 50% from Tuesday’s close, all four 2018 lows below will be violated. In that scenario, we do not know how they would be violated (normal downtrend vs. big gaps down). None of these levels were violated at the open on Thursday, December 6, 2018.

ciovacco-capital-short-takes-lows-218-a.png

Downtrends make a series of lower lows. Thus, each time a low is violated, the present day starts to look more and more like a long-term downtrend versus a wide range of consolidation that we have today.

Everyone is watching the same basic charts, which means stops tend to be set near the same levels, which can trigger somewhat of an air pocket or cascading effect near those levels. Often after all the stop orders are triggered, the market can find a bid (all TBD). Thus, under our approach, we do not use hard stops and we do not choose the most obvious levels as “time to act” triggers. We also take into account the possibility that key levels are often violated for a short period of time (a few hours or a day or two) only to be followed by a rally.

We have a very specific game plan based on numerous logical levels, allowing us to prudently balance and account for a wide range of possible outcomes, from wildly bearish to wildly bullish.

As of Tuesday’s close (markets were closed Wednesday), the S&P 500 was above all four major 2018 lows. That may change in the coming days and weeks, but it has not changed yet. It is important that we let logic, rather than emotions and red screens, dictate our actions during periods of high stress and anxiety.

As shown via the table below, the S&P 500 would have to fall 168 points on Wednesday to make a significant lower low below the February 9, 2018 low of 2532. A drop of 168 points is possible and we are prepared for all outcomes over the coming sessions. We are not making any assumptions about whether or not areas of possible support will hold or be taken out - they are simply reference points. We will to stick to our well-constructed and prudent plan while remaining cool, calm, and collected.

sh-low-2018.png

This post is written for clients of Ciovacco Capital Management and describes our approach in generic terms. It is provided to assist clients with basic concepts, rather than specific strategies or levels. The same terms of use disclaimers used in our weekly videos apply to all Short Takes posts and tweets on the CCM Twitter Feed, including the text and images above.

Markets Remain Near Important Crossroads

An October 27 Short Takes post contained the subheading “Inflection Point Says Stay Alert”. Since then, the S&P 500 has remained in whipsaw and yo-yo mode while making very little sustained progress either up or down.

ciovacco-capital-short-takes-whip-a.png

SITUATION REMAINS EXTREMELY FLUID

Wednesday’s market closure allowed for a big picture review spanning several hours and numerous charts. The two monthly stock vs. bond charts below help summarize the current situation. The top chart is as of Monday’s close and shows what appears to be a constructive rebound after a retest of the moving averages. Fast forward one day to the end of Tuesday’s session and the constructive look flips to a concerning look.

short-takes-ciovacco-s-v-b-1.png

DECEMBER IMPORTANT FOR BULLS AND BEARS

It is important to note, given the charts above are monthly charts, the final look that goes into the history books will not be determined until the end of December. The chart above could still flip back and forth between concerning and constructive over the next few weeks. The point is we need to pay attention and remain open to all outcomes from wildly bearish to wildly bullish. We could show numerous daily and weekly charts that share a similar “pay attention” look.

PLAN CAN/MAY BE ADJUSTED

A November 19 post stated the following:

“Concerns would increase if the October 29 low is exceeded, especially for more than a relatively short period of time (a few hours or a few days). Given the market’s renewed weakness during Monday’s session, it is prudent to have a detailed bearish game plan in place. “

After reviewing charts Wednesday, it is possible our current “bearish scenario” game plan will be adjusted to move at a faster rate (in bigger chunks). The plan was originally created in a manner that allows for tweaks based on how things unfold. Given the S&P 500 remains above all four 2018 lows (at least for now), we will see how things evolve in the coming days/weeks. Tuesday’s big drop increases the odds of the S&P 500 taking another significant leg down, something that was covered in a generic manner from a contingency perspective on November 23.

ciovacco-capital-short-takes-lows-218-a.png

Clients can find additional info/charts/comments on the CCM Twitter Feed.

REALISTIC EXPECTATIONS

2018 LOWS

Thus far, the S&P 500 has remained above all four 2018 lows shown below.

short-takes-ciovacco-cc-a1.png

YO-YOING NEAR RETRACEMENTS

Price action near the February low/September high (A to B) retracement levels tells us to keep an open mind about all outcomes. A prolonged stay above all three retracement levels would be a welcome sign, but falls into the TBD category. Monday’s open created a gap. The market may choose to backtrack and fill that gap; something that is not all that relevant to our longer-term investment horizon.

short-takes-ciovacco-ccb2.png

ANECDOTAL EXAMPLE

As shown via the 2011 case below, even if the recent lows in the S&P 500 hold, volatility will most likely be part of the day-to-day equation. There were no shortage of red sessions after the October 2011 low.

short-takes-ciovacco-bbc3.png

ALL CLEAR SIGNALS NOT PART OF THE REAL WORLD

After periods of volatility and stress, we want the market to calm down and give us some type of definitive “all clear” signal. After the low in 2011, the market did get “easier” given the S&P 500 rallied 72% between point A and point B. However, the orange boxes below highlight the number of pullbacks and red days that occurred in the “easier” market. If we were watching the market too closely after the 2011 low, it would have been easy to get baited into overtrading, which can lead to frustrating whipsaw after whipsaw.

short-takes-ciovacco-bb3s.png

MARKET STILL HAS WORK TO DO

The S&P 500 closed Monday 187 points above the October low and 258 points above the February low, providing some short-term breathing room. The bulls have made some progress over the past six trading sessions, but have yet to push the market above the previous rally attempt highs. We will continue to take it day by day.

THE BIGGER PICTURE

This week’s stock market video reviews present-day levels of concern relative to the periods following the 2000 and 2007 major tops.